
Control Tower Dashboard
One home screen for the whole network: headline KPIs, a live map of moving freight, open exceptions and the latest activity.
These images are illustrations of the concept, not screenshots of the actual product.
Overview
The Control Tower is the home screen of MoveTheWheels and the first thing an operations team sees when it opens a workspace. This concept illustrates a single dashboard that summarizes the state of the entire logistics network: how many orders are in the system, how many deliveries are rolling right now, how reliably loads arrive on time and how much revenue the operation generates, alongside a map of vehicles in motion and a short list of the problems that need a person's attention.
Logistics teams usually assemble this picture by hand from an order system, carrier portals, a tracking tool and a spreadsheet, and by the time it is assembled it is already out of date. The design replaces that routine with one screen where the headline numbers, the physical movement of freight and the exceptions all read from the same data, so a glance is enough to tell whether the network is healthy.
In the light theme, four KPI tiles for Total Orders, Active Deliveries, On-Time Delivery and Revenue each pair a large figure with a sparkline and a change indicator. Beneath them, a Live Map plots vehicle pins and route lines, with a Weekly order volume bar chart floating over its corner. The right column holds Exception Alerts, where each row names the problem and the shipment and carries a severity badge, followed by a Recent Activity feed with relative timestamps. The dark theme arranges the same content for control rooms and low-light shifts: sparklines sit under each figure, the map switches to a city street grid with glowing routes, exception alerts become color-coded pills and the order-volume chart moves into its own card in the right column.
Every element on the dashboard is designed as a doorway into a deeper part of the product. Alerts lead to exception handling, the map to shipment tracking and the live fleet view, order figures to order management and trends to analytics. The persistent left navigation lists those areas, from Orders, Tracking and Fleet through Inventory, Customers, Routes, Analytics, Finance, Marketplace and Reports to the AI Assistant and Settings.
What this concept shows
- Four KPI tiles for total orders, active deliveries, on-time delivery rate and revenue, each with a sparkline and trend indicator
- A live map of vehicle pins and route lines across the operating region
- An Exception Alerts panel that names each problem and the affected shipment with a severity badge
- A Recent Activity feed of shipment events with relative timestamps
- A weekly order volume bar chart across the days of the week
- A header with breadcrumb, search, workspace switcher, notifications and profile
- Light and dark themes that keep the same layout and information
How it works
- Open the workspace to land on the Control Tower and read the four headline KPIs.
- Scan the live map to see where vehicles are and which routes are active.
- Check Exception Alerts for delayed shipments and failed delivery attempts, marked by severity.
- Review Recent Activity to see what changed in the last few hours.
- Compare daily order volume across the week in the bar chart.
- Follow an alert, a map pin or a navigation item into the area that needs action.
Who it's for
- Operations managers and supply-chain leaders
- Dispatchers and control-room staff
- Customer service leads answering delivery questions
- Executives who want a daily check on network health
Illustrations
2 illustrations of this concept. Select one to view it full size.
Control Tower in the Light Theme
This illustration shows the Control Tower page in the light theme. The left navigation highlights Dashboard above entries for Orders, Tracking, Fleet, Inventory, Customers, Routes, Analytics, Finance, Marketplace, Reports, AI Assistant and Settings, while the header carries a breadcrumb, a search field, a workspace switcher, a notification bell and a profile photo. A row of four KPI tiles reports Total Orders, Active Deliveries, On-Time Delivery and Revenue, each with a sparkline and a colored change chip. Below, a Live Map plots truck pins joined by route lines, with a Weekly order volume card overlaid in its lower corner showing paired daily bars from Monday to Sunday. The right column lists Exception Alerts, one delayed shipment with a red badge and two failed delivery attempts with amber badges, above a Recent Activity timeline. A View Dashboard button sits at the top right. All figures and identifiers are sample data.
Control Tower in the Dark Theme
This illustration shows the same Control Tower in a dark theme intended for control rooms and night shifts. The navigation keeps its order, with AI Assistant and Settings set apart below a divider, and a Dashboard selector with a calendar icon sits beside the page title. The four KPI tiles show Total Orders, Active Deliveries, On-Time Delivery and Revenue with the same sample figures as the light theme, now with a glowing sparkline drawn beneath each value. The Live map card fills most of the page with a city street grid, blue route lines and orange truck pins. The right column stacks Exception Alerts as full-width pills outlined in red for urgent issues and amber for lower-severity ones, a Recent Activity list with an option to add an activity, and a Weekly order volume chart of slim bars on a value axis. The design demonstrates that the layout and its meaning carry across themes.
Topics
- logistics control tower dashboard
- supply chain visibility dashboard
- freight KPI dashboard
- on-time delivery rate
- live fleet map
- shipment exception alerts
- logistics operations dashboard
- dark mode logistics dashboard
- real-time delivery monitoring
Related concepts
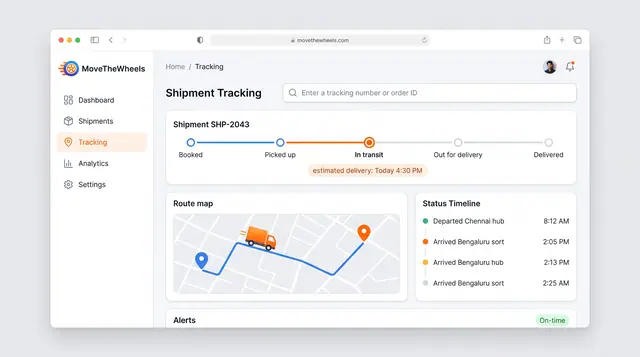
Shipment Tracking and Live Map
Follow one shipment from booking to delivery with an estimated arrival, then zoom out to every vehicle moving across the network.
2 illustrations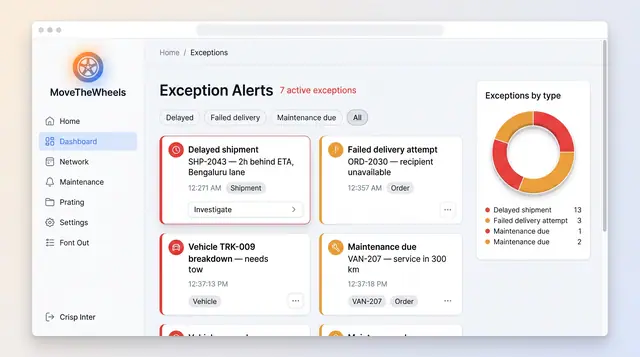
Exceptions and At-Risk Shipments
See delays, failed deliveries and maintenance issues in one board, plus a ranked queue of loads predicted to miss their window.
2 illustrations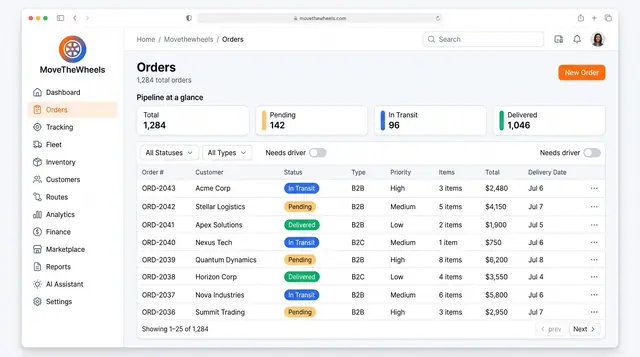
Order Lifecycle Management
Book a delivery, watch it move through the pipeline, assign a driver and vehicle, and keep its documents with the order.
3 illustrations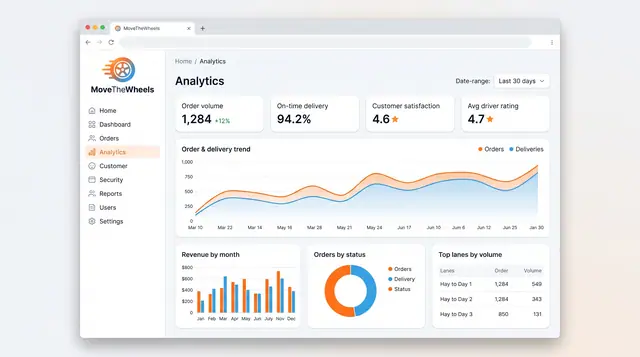
Analytics and Scheduled Reports
Follow order volume, on-time delivery, revenue and busiest lanes, then generate, export and schedule the reports your team relies on.
2 illustrations