
Freight Emissions by Lane and Carrier
Estimate CO2e for every shipment from distance, load and mode, compare lanes and carriers, and send the totals to the carbon ledger.
These images are illustrations of the concept, not screenshots of the actual product.
Overview
For sustainability and ESG teams, transport is one of the harder parts of a carbon footprint to measure well. It is commonly estimated from freight spend, which moves with prices rather than with tonnes and kilometers. This MoveTheWheels concept illustrates a Freight Emissions view under Analytics that is designed to start from each shipment's lane, cargo, vehicle and route distance, and to turn every shipment into tonne-kilometers and estimated CO2e, reported well-to-wheel.
The design lists rail alongside road modes such as trucks, tankers and cane trailers, so the same lane can be compared by road and by rail. The aim is to give logistics and sustainability teams the same numbers: which lanes and carriers are most carbon-intensive, how each figure was calculated, and what a change of mode would save.
The illustration opens with a quarter selector and tiles for shipments, tonne-kilometers, estimated CO2e and average intensity in grams per tonne-kilometer. A stacked bar chart splits each month's CO2e between the own fleet and contracted carriers. The Lanes table lists each lane with its mode, carrier, shipments, tonne-kilometers, tonnes of CO2e, intensity and a method label of fuel-based, distance-based or estimated. The sample lanes run between mills, a port terminal, a distillery, a blending depot, a city distribution center and cane estates, and the same mill-to-port lane appears by truck and by rail so the two can be compared. A Mode-shift proposal card suggests moving part of that road volume to rail, with the estimated saving per quarter and the added transit time, and offers to open it in the route planner or dismiss it.
Two other Burdenoff products complete the picture by design. Own-fleet lanes carry the fuel-based label, with liters per vehicle designed to arrive from the fuel-card export through FluidGrids, while contracted carriers are designed to use mode-specific distance factors from the EcoImpactHub factor library. Footer notes show how the totals are split: fuel liters via FluidGrids, own-fleet emissions already counted in Scope 1 and not re-sent, and contracted freight totaled as a Scope 3 Category 4 draft for EcoImpactHub, where the design envisions it being entered in the carbon ledger. Keeping a method label on every figure is meant to show reviewers which numbers come from fuel records and which are factor-based estimates.
What this concept shows
- Tiles for shipments, tonne-kilometers, estimated CO2e and average intensity for a chosen quarter
- A monthly stacked bar chart splitting CO2e between own fleet and contracted carriers
- A lanes table with mode, carrier, shipments, tonne-kilometers, CO2e and grams per tonne-kilometer, reported well-to-wheel
- A method label on every lane: fuel-based, distance-based or estimated
- Truck and rail figures for the same lane, side by side
- A mode-shift proposal with estimated saving and added transit time, to open in the route planner or dismiss
- Fuel liters from the fuel-card export designed to arrive through FluidGrids
- A Scope 3 Category 4 draft for EcoImpactHub, with own-fleet emissions kept in Scope 1
How it works
- Choose the reporting quarter to total shipments, tonne-kilometers and estimated CO2e.
- Compare own-fleet and contracted-carrier emissions month by month.
- Compare lanes and carriers by intensity and check the method label behind each figure.
- Review the mode-shift proposal and open it in the route planner, or dismiss it.
- Send contracted freight to EcoImpactHub as a Scope 3 Category 4 draft, leaving own-fleet emissions in Scope 1.
Who it's for
- Sustainability and ESG managers
- Logistics and transport managers
- Carbon accounting analysts
- Procurement teams selecting carriers
- Fleet managers
Illustrations
1 illustration of this concept. Select one to view it full size.
Freight Emissions by Lane with Mode-Shift Proposal
This illustration shows a Freight Emissions page under Analytics, with a quarter date-range selector. Four tiles give shipments, tonne-kilometers, estimated CO2e and average intensity in grams per tonne-kilometer. A CO2e by month chart stacks own-fleet and contracted-carrier emissions for three months. A Mode-shift proposal card suggests moving part of a mill-to-port road lane to rail, with an estimated quarterly saving, one extra day of transit, and Open in route planner and Dismiss buttons. The Lanes table, labeled well-to-wheel, lists lane, mode, carrier, shipments, tonne-kilometers, tonnes of CO2e, intensity and method. The mill-to-port lane appears by truck and by rail, alongside tanker, truck and highlighted cane trailer lanes. Method chips read fuel-based, distance-based or estimated. Footer notes show fuel liters via FluidGrids, own-fleet emissions already in Scope 1 and a Scope 3 Category 4 draft for EcoImpactHub. All data is sample data.
Topics
- freight emissions calculator
- transport CO2e by lane
- Scope 3 Category 4 emissions
- tonne-kilometer emissions
- well-to-wheel freight emissions
- carrier emissions comparison
- road to rail mode shift
- fuel-based emissions method
- logistics carbon reporting
- fleet fuel emissions
Related concepts
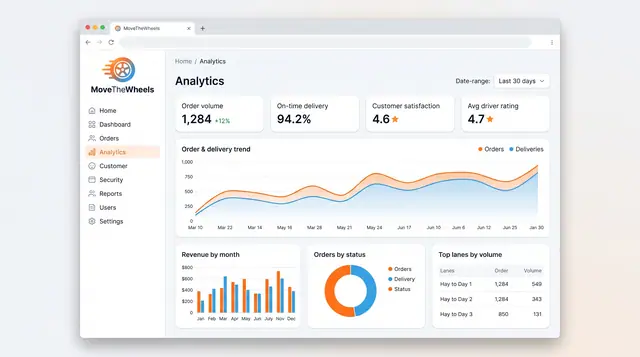
Analytics and Scheduled Reports
Follow order volume, on-time delivery, revenue and busiest lanes, then generate, export and schedule the reports your team relies on.
2 illustrations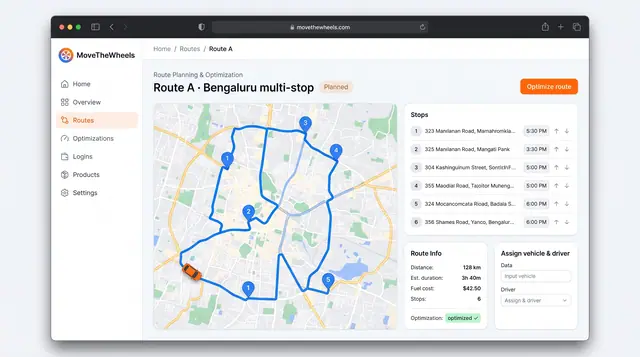
Route Optimization and Dispatch Proposals
Sequence multi-stop routes with distance, time and fuel cost in view, and review explained dispatch proposals before accepting them.
2 illustrations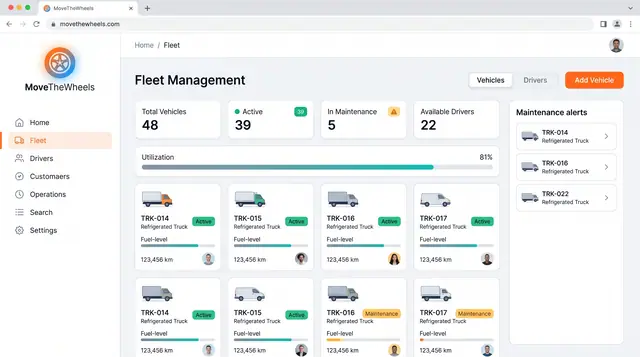
Fleet and Driver Management
See every vehicle and driver in one place: status, utilization, maintenance, documents and who is assigned to what.
3 illustrations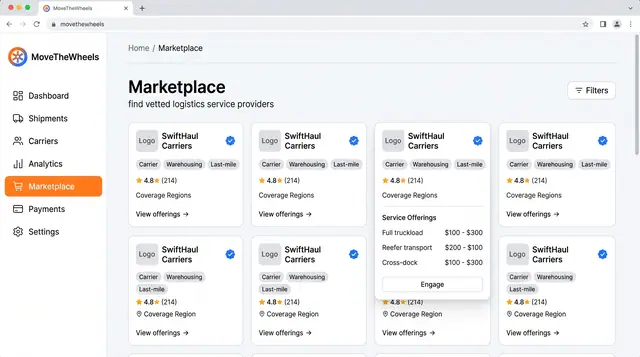
Logistics Provider Marketplace
Find vetted carriers, warehouses and last-mile partners, compare their offerings and ratings, and engage one when capacity runs short.
1 illustration
Part of an industry solution
This concept appears in a cross-product solution on burdenoff.com — see how it works alongside other Burdenoff products to solve a problem in that industry.